Exclusive Data and Expert Insight for Content Curious Leaders
5 Signs Your Digital Transformation Problem Is Really a Content Problem
By Colleen Jones and Content Science
The Ultimate Guide to End-to-End Content
Ready to modernize your organization’s content approach? Get Content Science's ultimate guide to end-to-end content.
read now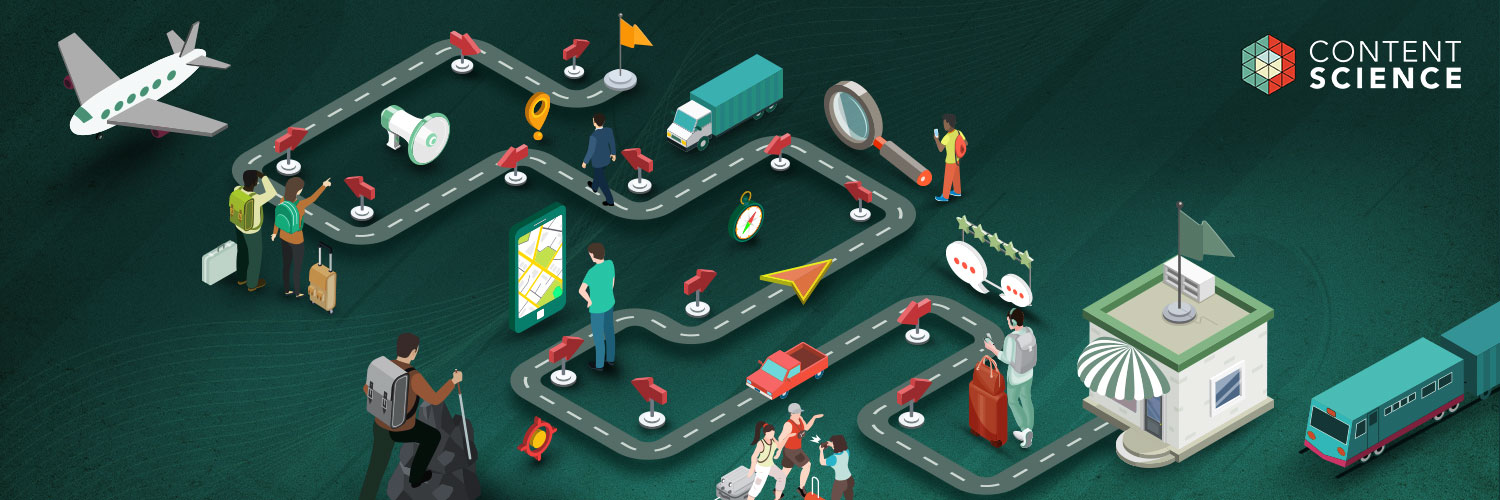
Customer Journey Map Template
By Content ScienceIf your organization wants to improve customer experience, you're ready to define a customer journey map with a Content Science template.
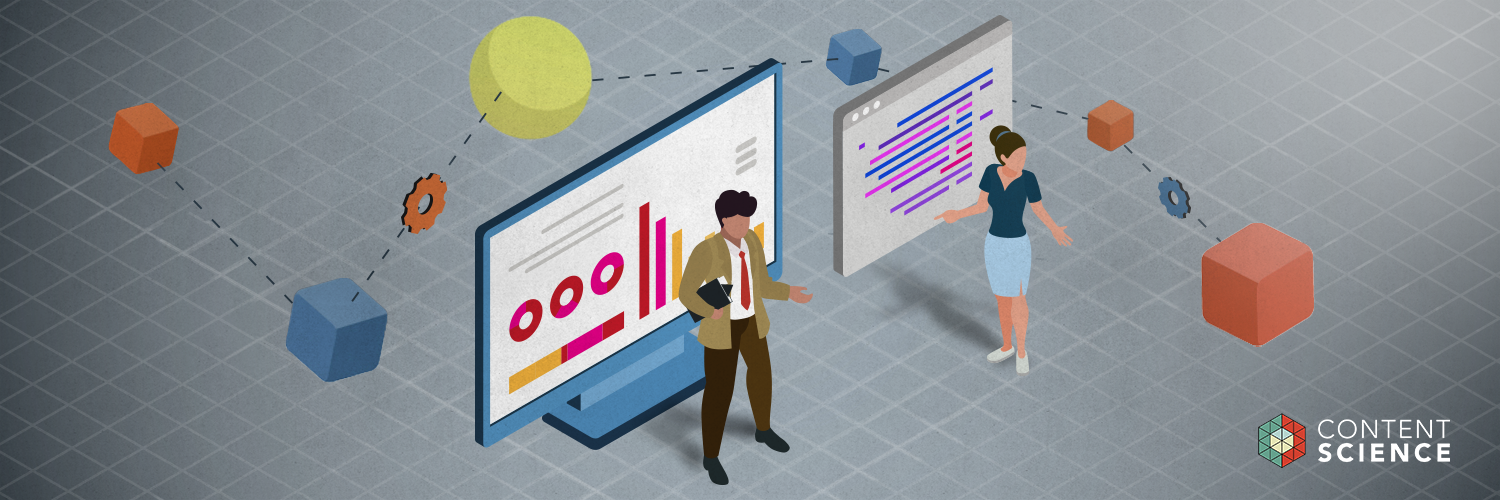
What Is a Taxonomy for Content?
By Content Science and Colleen JonesGet the basics about what a taxonomy for content is and the benefits for your organization and customers / users.
Health Content Fact Sheet
By Content ScienceThis collection of key facts and expert insights about health content includes content from Pew Research, Edelman, Forrester, and Colleen Jones.
Content Voice: Aligning + Scaling Your Voice Webinar Recording
By Content ScienceIn this webinar, Content Science founder Colleen Jones, shares how to define, align, and scale your content voice.
Content Technology Directory
By Content ScienceContent technology is essential to getting your content produced, published, and promoted. Consider these technologies and tools.
The SEO 411: Common Terms for Content Professionals
By Content ScienceLearn about key SEO terms, what they mean, and why understanding them is an important first step in successfully deploying your SEO strategy.
Popular Topics
Content Strategy
Developing approaches, plans, and more to achieve a content vision.
Content Operations + Systems
Managing content activities as effectively and efficiently as possible.
Content Effectiveness
Enabling customers or users to achieve their goals, while also achieving your goals.
Content Intelligence
Systems that transform data into actionable insights for content strategy and tactics.
Premium Content
Prepare Your Team for Success with Full Access to Our Research, Guides, Toolkits, and More
SubscribeSubscribe to Newsletters
Events, Resources, + More

Workshop: Are You Ready for AI?
Is your organization really ready for AI at scale? Let the Content Science team guide your leaders through assessing 4 areas of readiness.
Course: Prompting Text Generative AI
Learn how to bring out the full potential of text generative AI to create impactful content from this on-demand course.
Webinar: Benchmarks for Content Effectiveness
It's not about more content. It's about more effective content. Gain tips based on Content Science's unique research + experience.
The Ultimate Guide to End-to-End Content
Discover why + how an end-to-end approach is critical in the age of AI with this comprehensive white paper.